Hellomatik
World-record LLM speed on Raspberry Pi 5
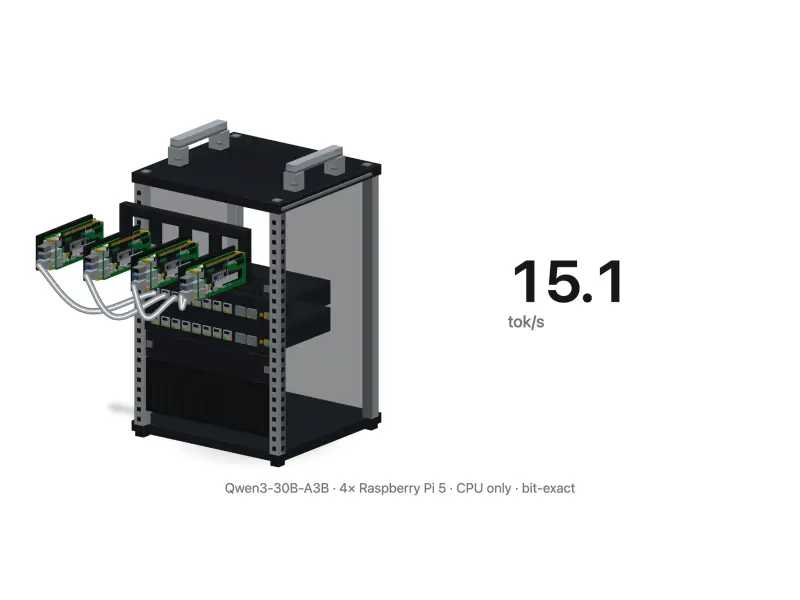
An open 30B MoE model at 15.1 tok/s on four Raspberry Pi 5 boards, 16.1% above the previous best. Bit-exact, no overclock. Paper and code public.
Key takeaways
- An open 30-billion-parameter model (Qwen3-30B-A3B) decodes at 15.143 tokens per second on four Raspberry Pi 5 boards, about 540 dollars of CPU-only hardware (500 euros in the paper) at 2025 board prices. As of May 2026, and to our knowledge, no faster figure has been published for this model on this class of hardware.
- The figure is 16.1% above the previous best, 13.04 tokens per second. On identical boards, with no confound, the like-for-like comparison reads +15.2%. Each of the 20 runs is verified bit-exact against a SHA-256 reference, with a 95% confidence interval of ±0.097 tokens per second.
- No single change produced it. Five measured levers did: model architecture +59%, runtime configuration +10.3%, a firmware memory setting +5.9%, source patches +5.6% and switching off two monitoring agents +5.18%.
- The ceiling is now physical: each node sustains 11.4 GB/s of memory bandwidth out of its roughly 17, and decode waits on memory rather than on code.
- The paper, the reproducibility package, the twelve source patches and the raw data are public on Zenodo and in an MIT-licensed repository, so the figure can be checked rather than taken on trust. The research is authored by Daniel Correa Villa, co-founder of Hellomatik.
Four Raspberry Pi 5 boards, about 540 dollars of hardware with no usable GPU, decode a 30-billion-parameter model at 15.143 tokens per second. The figure is verified run by run. It can be reproduced from public files. Its ceiling is memory bandwidth, not code.
The paper
The full study on Zenodo: every table, the twenty-six configurations that failed and the raw measurements.
What we measured and what record it sets
A 30B Mixture-of-Experts model decodes at 15.143 tokens per second on four Raspberry Pi 5 boards.
The figure is possible because of how the model is built, not because of how fast the boards are. The model is Qwen3-30B-A3B, an open Mixture-of-Experts model: it stores many small specialist networks and activates a few of them per token, so of its 30 billion parameters about 3 billion do the work on each token. That property decides everything on small hardware, because the bytes read per token set the speed.
The measurement is deliberately narrow. Decode is the phase that writes the answer, token by token. Its throughput here is 15.143 tokens per second over 20 runs, with a 95% confidence interval of ±0.097 tokens per second, using the exact command published by the previous record holder.
Every run is verified bit-exact: the SHA-256 hash of the generated tokens matches a fixed reference, at temperature 0. Nothing is overclocked. No quality is traded away.
World record here means what it means in any field without a referee: the best result anyone has published. It is an open invitation to anyone to beat it. The previous best was result #255 in the b4rtaz repository, at 13.04 tokens per second.
No organisation certifies this kind of measurement. What stands in for one is the audit trail. The output is bit-exact, the configuration is public, and anyone with four boards can check it.
The prior figure was measured on 8 GB boards; ours are 16 GB boards. The paper also reports the comparison with no confound: on our own boards the unmodified framework gives 13.15 and the optimised configuration gives 15.143, a 15.2% difference on identical silicon. The 8 and 16 GB boards share the same memory bandwidth, which is the resource that decides decode speed.
Hellomatik as an AI laboratory
While we develop products, the lab works on the same machines we later install at client sites, so that we know the limits of the hardware we hand over.
This is a requirement and not a preference, because what goes on a machine at a client's site has to be committed to before it is installed. Hellomatik builds one thing: an agent that has read what a company already has and answers with it. The company's documents go into a knowledge space. The company's conversations arrive from two places, the chat widget on the company's own site and a verified WhatsApp Business number, and both land in the same inbox.
Every answer carries its sources with it. Open an answer and the dashboard lists the exact fragments of the documents the answer was built from. It also lists the rows of the connected database when the answer came from one. The person who reads it can check the claim before repeating it to a customer.
The agent also acts on what the company already runs. It can operate twenty-eight platforms, from HubSpot and Mailchimp to Meta Ads and the Google Business Profile, and it builds the automations that use them. For example, on a Google Business Profile it does more than read. It lists the reviews, drafts an answer to one and publishes it as the owner. It also reports how many searches, calls and route requests the listing produced. The agent works inside the tools the company already pays for. All of that normally runs on our servers.
This work exists for the other case: the clinic or the company that will not let its documents leave the building. The measurement above is what tells us, before we promise anything, that a machine like that can hold a conversation at reading speed but cannot swallow a long contract. The Raspberry Pi 5 is the board our clients are most likely to already own, so it is where we practise.
Hellomatik operates as an AI laboratory. It investigates two things on its own boards: what the machines can sustain and which optimisation methods carry over to models of this size. What survives that filter is applied afterwards to solutions for mid-size and large companies. The research itself runs on public material, and this study is that filter, applied in public.
This study was led by Daniel Correa Villa, co-founder of Hellomatik. It is published the way the lab always publishes. The paper is on Zenodo, with a reproducibility package carrying the exact configuration. A public fork under the MIT licence holds the twelve source changes with their rationale. It also carries the raw CSVs of the decisive A/B runs. Publishing the failures alongside the successes is part of the method, and the paper documents twenty-six configurations that did not work.
For a company weighing an on-premises deployment, that means the numbers we quote arrive with the method and the machine they were measured on.
These are not our production models
The hardware and the five constraints
Four identical boards, Gigabit Ethernet, no usable GPU and five rules that every change had to obey.
The hardware deserves detailing, because every number below is a property of it and not of the software. Each node is a Raspberry Pi 5: four Cortex-A76 cores at 2.4 GHz and 16 GB of LPDDR4X memory with a vendor ceiling of roughly 17 GB/s. The four boards talk over Gigabit Ethernet with 0.226 ms of latency between them. There is no usable accelerator: the Pi's GPU exposes no compute features for this workload, and there is no NPU. Everything below happens on the CPU.
One board receives the request and serves the API. The other three each hold a share of the weights, and every layer is agreed across the four before the next token leaves.
The cluster behaves like a laboratory instrument rather than a hobby rig. Sustained load holds the four boards between 54.3 and 56.0 degrees Celsius, far from the 85-degree throttling threshold, with zero throttling events recorded. The root node uses 12 of its 16 GB and each worker about 6.3 GB, leaving headroom for the growing conversation cache. Run-to-run variation at a fixed configuration is 0.52%, which is what makes one-per-cent effects measurable at all.
Five constraints framed the work, adopted as design rules: (1) bit-exact output, checked by hashing the generated tokens against a fixed reference; (2) no CPU overclock; (3) no model change; (4) the stock operating-system kernel; (5) no quality reduction, with the expert count untouched. The constraints rule out most quick wins in the literature. They also make every surviving gain deployable, because nothing depends on a fragile trick.
What each lever contributed
The biggest of the five levers was choosing the right model architecture.
The record is a sum because no single change was ever big enough on its own. The trajectory is public in the paper, stage by stage, and it starts low. A dense 8B model on this cluster ran at 5.70 tokens per second. Switching to the Mixture-of-Experts model lifted the baseline to 11.40, because far fewer bytes move per token.
From there the work went into source patches (eight to the framework, four to compute kernels), operating-system tuning and one firmware setting. Sustained throughput reached 14.449. The final decode measurement, taken with nothing else running on the node, reads 15.143.
The trajectory says when each gain landed. The next chart shows how much each lever is worth on its own, measured in isolation.
The chart, read left to right, shows where the speed comes from. The architecture dominates: a model that reads 3 GB per token instead of 5 beats any code tweak. The runtime lever is configuration rather than code: three threads instead of four, with the network interrupt pinned to the freed core, plus a different memory allocator.
The firmware lever is one setting, memory interleaving in the bootloader, that lifted measured read bandwidth per node from 8.3 to 12.5 GB/s. The twelve source patches, the part that looks most like engineering, contribute a clean but modest 5.6%.
The 59% above and the jump from 5.70 to 11.40 measure the same lever against different baselines. The percentage is the isolated A/B run with everything else already tuned; the jump from 5.70 was measured on the starting configuration, with nothing else touched.
Two findings run against received wisdom. The first: removing the manual prefetch hints from the hottest loop made it faster, because the chip's own prefetcher predicts that access pattern better than the hints did. The second: rewriting a two-step kernel as a single pass added 1.5%, because the intermediate values never leave the registers. In short, on this silicon two pieces of standard advice were costing time. Both survived only because every stage was measured against its own baseline, bit-exact.
The fine detail is documented commit by commit. One patch fixed an integer overflow that silently turned a batch size of 256 into 0. The kernel fusion removed 224 synchronisation barriers per token, each one a point where the cores stop and wait for each other before going on.
Raising the network chunk size from 4 to 16 KB cut the system calls per synchronisation slice fourfold. The final barrier change swapped busy-waiting for ARM's event mechanism: 0.48% faster, statistically significant, and the waiting cores run cooler.
The paper also documents what the surveyed literature got wrong. One published claim of +5 to 40% turned out to be already present in the code base, and a gain cannot be captured twice. Another, +20 to 30% from an ARM instruction repack, did not survive contact with the hardware, because the Pi 5's cores do not implement that instruction. So a published speed-up counts only once it has been measured on the machine in front of you.
A structured pass over recent systems papers produced about fifteen more candidates. Their net measured effect on this cluster was zero. The techniques assume a newer kernel, silicon features this board lacks, or a reboot or rebuild that the constraints ruled out.
The ceiling is memory bandwidth
Decode on this cluster waits on memory bandwidth, and the profiler shows it directly.
The ceiling is physical because the cores spend their time waiting for data rather than computing it, and ARM's performance counters locate that without ambiguity. During decode, 49% of CPU cycles stall on the memory subsystem, and each node sustains 11.4 GB/s of its roughly 17.
The arithmetic checks out: with about 3 GB of weights active per token, four nodes could reach roughly 22.6 tokens per second if memory were the only cost. At its sustained rate the cluster reaches 64% of that.
The profiler also splits each token's time into four buckets, and the split explains the whole strategy:
The compute side is already at its instruction-set limit, with 322 vector dot-product instructions in the hot loop running at 1.74 instructions per cycle. That is why every compute-side experiment in the paper returns zero: the cores stall on memory rather than on arithmetic.
Most of the remaining gap is synchronisation: the four boards agree on every layer. That agreement costs about 12.3 ms per token, 17.7% of the token's time in the paper's stage-12 profiling. The barrier share is the only software-addressable slack left, and it is what the overlap work targets.
In other words: the code is no longer the limit. Past this point there are two real levers. One is hardware with more memory bandwidth. The other is overlapping communication with computation: the one software direction left, already scaffolded in the repository (an estimated 250 lines of integration).
Monitoring is not free on memory-bound inference
Twenty-six configurations that did not survive
The paper documents all twenty-six, and the failures map the terrain. Some were measured and failed; others were ruled out by a constraint or by the literature, and the table says which.
The failures are published because each closed door, named in advance, is a day nobody else spends opening it.
| Configuration | Result | Why |
|---|---|---|
| Llama 3.3 70B on the same cluster | 0.15 tok/s | 38 GB of weights, 9.5 per node: they barely fit and the cache forces swap |
| EXO framework | does not start | requires Apple's MLX stack; ARM alone is not enough |
| prima.cpp | hangs | topology discovery never completes on Pi 5 |
| llama.cpp in RPC mode | 0.28 tokens/s with Llama 3.3 70B | per-token network overhead dominates (measured by Jeff Geerling on his Pi cluster) |
| The Pi's GPU (Vulkan) | unusable | render-only driver, no compute features |
| CPU overclock to 2.7 GHz | excluded | ruled out by constraint; ~12% was the expected gain |
The table shows six of the twenty-six; the paper documents them all. On ARM Linux without an accelerator, then, the practical road today is tensor parallelism over Ethernet, which means every board holds a slice of each layer and the four agree before the token moves. Most other doors are closed. Publishing the closed doors is part of the result.
What the repository ships
Everything needed to reproduce the record is public: the fork, the patches, the service files and the raw data.
All of it is public because a record nobody can rerun is an anecdote. The work is in the hellomatik-org fork of distributed-llama, on the pi5-cluster branch, under the original MIT licence. The twelve source changes ship with their rationale, one by one. Four systemd units (API, worker, CPU governor, interrupt pinning) plus a runtime-tweaks service mean a cold cluster boots straight into the record configuration.
The serving side speaks the OpenAI-compatible HTTP protocol, with a small proxy that sanitises requests for strict clients. In practice that means existing tools connect to the cluster the way they would connect to a hosted API, by changing one base URL. The reproducibility package on Zenodo bundles the full configuration for download.
The repository also preserves the trail. A companion repository, now archived, records the 13.82-tokens-per-second configuration that preceded the consolidated fork. The raw CSVs of the decisive A/B runs (telemetry and barrier) are versioned in the fork, some of them next to the paper's LaTeX sources.
From clean boards to a serving cluster
Clone and build
The pi5-cluster branch builds with the Cortex-A76 flag set on each node. The deployment scripts in the reproducibility package do the copying.Install the units
Four systemd services plus the runtime-tweaks unit: API on the root, workers on the other three, governor and interrupt pinning everywhere.Load and lock the model
The quantised model is downloaded once and locked into RAM, about 4.45 GB per worker, so the first request does not page.Connect a client
The root serves an OpenAI-compatible endpoint, and the package documents the exact benchmark commands used in the paper.
What a cluster like this could serve today
The measured envelope says which uses fit: short prompts in, streamed answers out, one client at a time.
The envelope is narrow because the two phases of a conversation do not cost the same. Fifteen tokens per second is a comfortable streaming speed for a person reading along. The first token arrives in just over half a second. With short prompts the cluster holds a conversation without feeling slow. What it cannot do today is swallow long documents: prefill costs about 2 minutes per 2,000 tokens of input.
| Inside the envelope today | Outside it, for now |
|---|---|
| Question-and-answer over short context, on premises | Long documents in the prompt (about 2 minutes per 2,000 tokens) |
| Counter or kiosk assistants with short prompts | Agent workloads with large system prompts |
| Batch generation where latency does not matter | Several simultaneous users (single-client measurements only) |
| Development against an OpenAI-style API, offline | Anything that needs certified energy figures |
The table is our reading of the paper's measurements, not a product promise; the paper itself only claims what it measured.
For Hellomatik the value of that envelope is the guide it gives us for client conversations. When a mid-size or large company asks for answers that never leave the building, we can say what a 540-dollar shelf of boards sustains, what it does not sustain and what the next hardware step buys. That is the laboratory at work: measured limits instead of vendor promises.
The engineering detail, stage by stage
The eight framework patches
An integer overflow that turned batch 256 into 0. A forced finish_reason so strict OpenAI-style clients stop retrying forever. A try/catch around JSON parsing so malformed bodies stop killing the daemon. A header append that truncated UTF-8 text. A new flag to set the batch size. 64-byte alignment for pipe buffers. 8 MB TCP buffers. A pre-reserved response buffer. Each patch ships in the fork with its rationale.
The operating-system bundle
Performance governor at boot. TCP BBR with enlarged buffers and receive offload disabled. Swappiness at 1 with the model weights locked in RAM, about 4.45 GB per worker. NVMe scheduler set to none. Receive Flow Steering with the network interrupt pinned to the core freed by running three threads instead of four. All of it persisted in systemd units, so a cold boot comes up optimised.
The measurement discipline
Two discarded warm-up runs, then twenty measured runs per configuration, fixed prompt, temperature 0. Every stage hashed against a fixed reference: a change that alters the output does not count. Session-to-session drift of one to two percent with ambient temperature was handled with same-session paired A/B runs. Time to first token averages 557 ms. Run-to-run variation is half a percent.
What is left on the table
The paper's ranked candidates, all marked as estimates: wiring the async tensor-parallel foundation already in the repository (estimated +5 to 12%, high integration risk), a hierarchical all-reduce (estimated +10 to 13%), expert prediction ahead of attention (estimated +8 to 15%, model-specific) and a fused expert operation (estimated +8 to 12%). None of the four is measured, and the paper says so.
The four limits of this result
The record is real and narrow, and four limits say exactly how narrow.
The limits belong here because the headline on its own would mislead: +16.1% says nothing about which phase was measured. The first limit is the input side. Decode is the record; prefill, the phase that reads the prompt before the first token appears, is slow: about 2 minutes per 2,000 tokens and a projected 20 minutes for 20,000. A use case built on long prompts is outside what this cluster serves today.
The second: the headline comparison spans two board models, 8 GB boards against our 16 GB boards. Bandwidth is identical and the confound-free chain on our own silicon reads +15.2%, but the +16.1% headline inherits that caveat.
The third groups three smaller ones. Throughput was measured with a single client. Energy was not measured directly: about 2 J per token is an estimate rather than a reading. Output quality against the dense model was checked for coherence rather than formally benchmarked.
The fourth is the reading itself. The result should be read as a ceiling study for this hardware class, verified as of May 2026, not as a claim that four Raspberry Pis replace a server. At a similar price, a Mac Mini M4 decodes this class of model faster, about 25 tokens per second. The lab's goal was not tokens per dollar.
One caveat arrived after the measurements. The paper's 500 euros, about 540 dollars, is what the hardware cost when the lab bought it. A memory shortage has since pushed the 16 GB Raspberry Pi 5 from 120 dollars to 305 dollars at Raspberry Pi's own list price.
Four boards at that price are 1,220 dollars, which is our own arithmetic and not a figure from the paper. The measurements do not move. The argument about price does.
None of this weakens the finding. The physical limit of the most widely deployed edge board is now mapped, bit-exact, and the map is public.
What transfers beyond this cluster
The distance that remains to the theoretical ceiling is a property of the silicon, not of the software. That is what the lab set out to learn.
The transferable part is the method: fix hard constraints first, measure every stage against its own baseline and keep the output bit-exact so no gain can hide a quality loss. Then publish the failures with the successes. The complete configuration, the twelve patches and the raw data are public under an MIT licence. The paper names its own next lever: overlapping communication with computation, already scaffolded in the repository.
What Hellomatik takes home is the discipline. When a solution has to live on a physical machine at a client's site, we want to know, with measurements rather than opinions, what that machine can and cannot sustain.
Sources
- 1.Correa Villa, D. (Hellomatik), Pushing Four Raspberry Pis to the Memory Wall: Bit-Exact 30B Mixture-of-Experts Inference, +16% over the Public Record. May 2026. All performance figures in this post come from this paper (n=20, 95% confidence intervals, measurements of May 2026).
- 2.Reproducibility package: configuration, twelve source patches, systemd units and deployment scripts (MIT licence). July 2026.
- 3.Prior public ceiling: 13.04 tok/s decode, result #255 (Tadych) in the b4rtaz/distributed-llama repository, on four 8 GB Raspberry Pi 5 boards.
- 4.The fork used in this work: hellomatik-org/distributed-llama, branch pi5-cluster, forked from b4rtaz v0.16.5.
- 5.Raspberry Pi 5 board prices: 16 GB launched at 120 dollars (Jan 2025) and rose to 145 (Dec 2025), 205 (Feb 2026) and 305 at the time of writing, driven by the LPDDR4X shortage.
Frequently asked questions
- In what sense is this a world record?
- In the sense the phrase carries in any field without a referee: no one has published a faster decode figure for this model on this class of hardware, and the previous best of 13.04 tokens per second is beaten by 16.1%. No organisation certifies results of this kind. What there is instead is an audit trail: bit-exact output, the exact configuration published and a reproducibility package anyone can run. One caveat travels with the headline: the previous figure was measured on 8 GB boards and ours are 16 GB. On identical silicon the gain is 15.2%.
- Can I reproduce it?
- Yes. The fork is public under MIT, the branch is pi5-cluster, and the reproducibility package includes the twelve patches, the systemd units, the exact configuration and the raw data. An identical cluster (four Raspberry Pi 5 boards) should reproduce it; the paper has not validated the figure on other hardware.
- Are these the models Hellomatik uses in its product?
- No. The study uses open research models because they have published baselines to compare against. The models behind our agents are a separate matter, and we do not disclose them in this line of research.
- Why Raspberry Pi instead of a Mac Mini or a GPU?
- At a similar price a Mac Mini M4 decodes faster, around 25 tokens per second. The goal was not the best tokens per dollar: it was the ceiling of this class of edge board, and an optimisation method that transfers to other machines.
- What would make it faster?
- Hardware with more memory bandwidth, or overlapping communication with computation (Async Tensor Parallelism), estimated at about 250 lines of integration on scaffolding already in the repository. Options that trade quality, such as fewer active experts or more aggressive quantisation, which stores each weight in fewer bits, were deliberately out of scope.
Answers that cannot leave the building
If your documents cannot go to somebody else's servers, tell us about it. What we measured here is what lets us say, before promising anything, what a machine at your site can handle and what it cannot.
Who made this
- Research and engineering
- Daniel Correa Villa